Tide and Current Tables
Use Tide and Current Tables to find:
- Times and heights of tides a reference ports;
- Direction and rate of current at reference stations.
Tide is the vertical height of water and current is the horizontal flow of water. No to be confused with other currents, tidal current is the movement of water associated with the rise and fall of tides. In the following, we will be referring to tidal current only.
Tides are caused by the gravitational pull of the sun and moon – the moon having the greatest gravitational pull because it is the closest to the earth. Tides for the most part are semidiurnal – occur twice a day. The position of the sun and moon in relation to each other changes daily. Accordingly, the time and height of tides changes daily. Tides vary from region to region with the Bay of Fundy on the Eastern Coast of Canada having and extreme tidal range of over 8 meters.
When the water begins to rise and flow inland this is called the tidal flood . Alternatively, when the water begins to recede and flow back out to the ocean, this is called the tidal ebb. Under the Lions Gate bridge in Vancouver, British Columbia, the flood and ebb can reach speeds of over 6 knots.
When the tide reaches it’s maximum height, the current or water movement slows to an eventual stop before it changes direction and begins to head back out to sea. This period where the water has stalled, is called the Slack before Ebb or Turn before Ebb. Similarly, once the tide has receded the tidal ebb slows to an eventual stop before turning around and heading back to shore. This is called the Slack before Flood or Turn before Flood.
Understanding tide and current is essential for safe boating along coastal areas. Tide and current can work for you or it can work against you. It is important, therefore to always carry onboard a copy of the Canadian Tide and Current Tables published by the Canadian Hydrographic Services (CHS) – a department of the Government of Canada.
Let’s start by taking a look at a tide table.
Times are given using the 24 hour clock and in this instance, in Pacific Standard Time (PST) which is 8 hours behind (Z-8) U.T.C. (Coordinated Universal Time – formerly known as Greenwich Standard Time). Always remember to convert table times from Standard Time to Daylight Savings Time by adding 1 hour.
On July 1st, 2015, (Victoria), the lowest tide of 3.0 feet (0.9 meters) is at 11:45 and the highest tide of 7.9 feet (2.4 meters) is at 15:58. Tide heights are added or subtracted to charted depths. If the charted depth was 20 feet (6.1 meters), at low tide, the water depth would be 23 feet (7.0 meters) (20 + 3 = 23)
The Canadian Tide and Current Tables – Vol. 5, also provides a Tidal Graph to calculate tide heights at a given time.

Tidal time is given along the top of the graph and tidal height is shown along the left margin. At approx. 18:00 hrs, we can see that the height of the tide is approximately 1.6 meters (5.3 feet). Correcting for Daylight Savings Time, this would become 1.6 meters (5.3 feet) at 19:00 hrs.
The following extract from the Canadian Tide and Current Tables – Vol. 5, Current Table, sets out the time and height of the tide for the Gabriola Passage on July 1st, 2015.

There are two columns for Time. The first column, in bold print, shows the times of the Turns – Turn before Flood or Turn before Ebb (also known as the Slack before Flood and the Slack before Ebb). The speed of the water is shown in Knots. The plus sign (+) represents Flood and the negative sign (-) represents Ebb. In the afternoon, the Turn before the Flood (Slack before Flood) is at 12:45 (13:45 PDT) and the time of the maximum Flood is at 16:07 (17:07 PDT).
It would be impossible to provide tide and current charts for every single location.
Accordingly, a station that has it’s own specific tide and current tables will act as a reference station for a secondary location that does not have it’s own tide and current table. The secondary location is referred to as a Secondary Station.
Secondary Ports – Tide
The Canadian Tide and Current Tables – Vol. 5 will have an index of all reference ports being used for the Vol. 5 area. Taking the following extract, we can see that Victoria is a reference port.
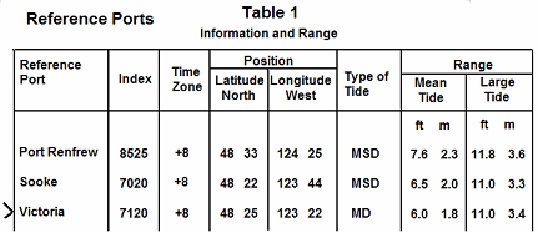
Latitude and Longitude of each reference port is provided to determine which reference port is applicable. This is especially valuable if you are not familiar with the sailing area.
More detailed information about tide levels is provided for reference ports in Table 2 of the Canadian Tide and Current Tables – Vol. 5.

Tide heights are divided into two categories, Higher High Water and Lower Low Water levels. Each category is divided into two sub-categories, Mean Tide and Large Tide.
In practical terms, lets say that on the afternoon of July 1st we are sailing near Latitude 48°26.20’ N and Longitude 123°17.50’ W. When we look at the reference ports we see that the closest reference station is Victoria but we are not at Victoria so we look to see if there is a secondary port that is more approximate to our position.
When we look at the Secondary Ports listed in Table 3 of the Canadian Tide and Current Tables – Vol. 5, we see that Oak Bay is located at Latitude 48°26.00 N and 123°18.00’ W, a secondary port very near our position. Accordingly, we will use secondary port Oak Bay as our source of tide information.
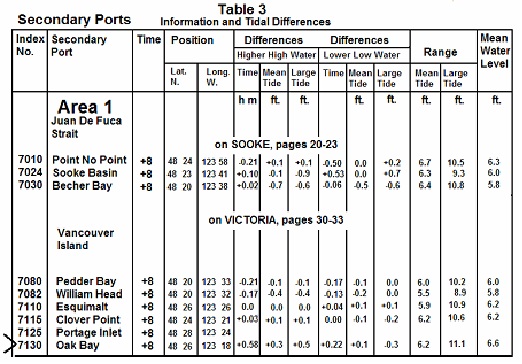
When we look at the data in Table 3, we can see that the reference port for Oak Bay is Victoria. We must now look at the tide table for Victoria on July 1st, and using the constants for the differences in Higher High Water and Lower Low Water in Table 3, calculate the height and time of High and Low tides for Oak Bay on July 1st.
The Canadian Tide and Current Tables – Vol. 5. pr ovides us with the following daily reference tidal information for Victoria – July 1st, 2015.
We now have all the information needed to calculate the times of High and Low water at secondary port Oak Bay on July 1st, 2015.
The next step is to determine whether we are going to use the Mean Tide or the Large Tide differences set out in Table 3 to calculate our predictions for Oak Bay.
We do this by comparing our daily prediction information for Victoria shown above to the Mean Tide and Large Tide information found on Table 2, Tidal Heights, Extremes and Mean Water Level.
Since we are sailing in the afternoon so we will focus on the following afternoon daily prediction times for Victoria:
11:45 Low Tide – 3.0 Feet or 2.1 Meters
19:58 High Tide – 7.9 Feet or 2.4 Meters
When we compare the daily prediction Low Tide height of 3.0 Feet or 2.1 Meters for Victoria, July 1st, 2015 to the Victoria Lower Low Water, Mean Tide and Large Tide differences found in Table 2, we see that the daily prediction of 3.0 Feet/2.1 Meters is closer to the Lower Low Water, Mean Tide of 2.2 Feet/.07 Meters than the Lower Low Water, Large Tide of 0.1 Feet/0.0 Meters.
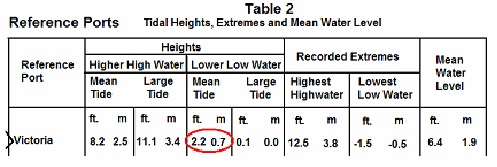
Accordingly, we will use the Mean Tide differences under the heading of Lower Low Water in Table 3 to calculate our low tide predictions for Oak Bay.
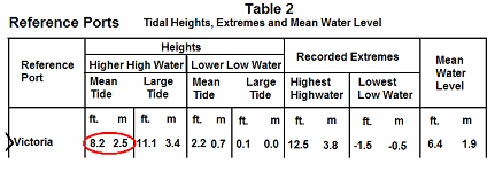
When we compare the daily prediction High Tide height of 7.9 Feet or 2.4 Meters for Victoria, July 1st, 2015 to the Victoria Higher High Water, Mean Tide and Large Tide differences found in Table 2, we see that the daily prediction of 7.9 Feet/2.4 Meters is closer to the Higher High Water, Mean Tide of 8.2 Feet/2.5 Meters than the Higher High Water, Large Tide of 11.1 Feet/3.4 Meters.
To summarize, we have taken our daily predictions from Victoria and compared them to the High and Low water differences found in Table 2 for Victoria. We do this in order to determine whether we will be using the High and Low water Mean Tide or Large Tide differences for Oak Bay on Table 3.
In our example, the daily predictions were closer to the Mean Tide heights for Higher High Water and Lower Low Water on Table 2 and therefore we will be using the Mean Tide levels for both high and low tide calculations. (In some situations you may use the Mean Tide for High Water and the Large Tide for Low Water or vice versa.)
We can now create our own table to calculate the daily prediction for Oak Bay on July 1st, 2015
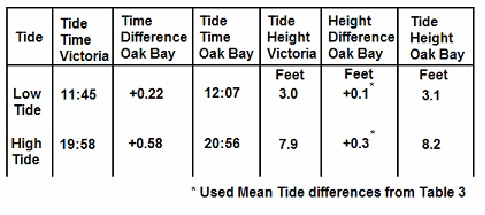
Column 1 Tide has been divided into High and Low Tide.
Column 2 Shows the daily time predictions of high and low tide for Victoria on July 1st, 2015.
Column 3 Contains the time differences between Oak Bay and Victoria. This information was obtained from Table 3.
Column 4 Shows the predicted high and low tide times for Oak Bay by (in this case) adding the time difference. (+ means add – means subtract)
Column 5 Shows the daily tide height predictions (high and low) for Victoria on July 1st, 2015.
Column 6 Contains the height differences between Oak Bay and Victoria. This information was obtained from Table 3 using the Mean Tide data.
(Remember the High and Low tide daily predictions were closer to the Mean Tide data in Table 2. That meant we were to use the Mean Tide data in Table 3 as opposed to the Large Tide data.)
Column 7 Shows the predicted high and low tide heights for Oak Bay by adding the tide height difference.
We have now determined the times and height of high and low tide at our location near Oak Bay. However, this is for P.S.T. (Pacific Standard Time). Since daylight savings time (P.D.T.) would be in effect in July, we must add 1 hour to our predicted times to convert to P.D.T. This means that the Low Tide at Oak bay would occur at 13:07 and the High Tide would occur at 21:56.
Knowing the tide height is just one part of the equation. We need to know the correlation between tide height and overall water depth.
Tide heights are added or subtracted to the water depth shown in the chart to determine water depth at high and low tides.
Continuing with our example near Oak Bay, we have decided to anchor. Our chart indicates that the water depth is 6 m. or 20 ft. Using high and low tide calculations for Oak Bay, at high tide the water depth will be 28.2 ft (20ft. + 8.2ft. = 28.2 ft.) or 8.59 m. At low tide we the water depth will be 23.1 ft (20ft. + 3.1 ft. = 23.1ft.) or 7.04 m.
To maintain a 7:1 scope on our anchor rode at high tide, we will need at least 197 ft. or 60 m. of anchor rode in the water (7 X 28.2 ft. = 197 ft.). At low tide we do not need to worry about grounding and if we wish to reduce our area of swing, we could reduce the anchor rode to 161 ft. or 49.2 m. (7 X 23.1 ft. = 161 ft.) and still maintain our 7:1 scope.
Secondary Stations – Current
It would be impossible to have specific current data for every possible area and so current also has uses reference and secondary stations.
For the purposes of our example we will assume that we are sailing on the afternoon of July 17th, 2015 and that our co-ordinates are 48° 20.00 N and 124° 06.00 W.
When we look at the index for Reference and Secondary Stations – Table 4, we discover that our co-ordinates do not match any of the co-ordinates for the reference stations listed. We must then check to see if we are at or near a secondary station.
(The following is an abbreviated version of Table 4. All reference and secondary stations have been removed except those applicable to our example.)
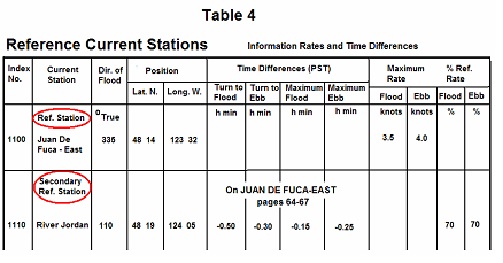
The secondary reference station River Jordan is closest to our co-ordinates, so we will use the rate and time differences at River Jordan to calculate the rate and time of current at our location. We can see that the reference station for River Jordan is Juan De Fuca-East.
Table 4 also gives us the direction of the Flood – 335°T at Juan De Fuca-East and 110°T at River Jordan. (The direction of the Ebb would be 180°T in the opposite direction of the Flood.)
You will note that Table 4 provides no Flood or Ebb information for reference station Juan De Fuca-East. Flood, Ebb and Turn/Slack times vary daily, making it impossible to include all this information in Table 4. Accordingly, we must look at the daily current predictions for Juan De Fuca – East – July 17th, 2015 and using the Time Differences in Table 4, calculate the predicted times of Flood, Ebb and Turn/Slack.
Since we are sailing during the afternoon, we will focus on the afternoon predictions.
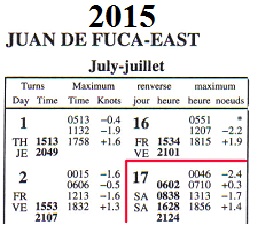
We can see that the Turn/Slack before Flood occurs at 16:28 PST and that the Flood reaches it’s maximum speed of 1.4kts. at 18:56 PST.
Taking the daily prediction times for Current, and using Table 4 Time Differences for secondary station River Jordan, we can now predict the times of the Flood, Ebb and Turns for our location near River Jordan.

Our calculated times are based on PST and so we must add one hour to convert our predicted times of Turn Before Flodd and Flood to PDT. This means that we can expect the Turn Before Flood to occur at 16:48 hrs. PDT and the Flood to reach it’s maximum speed at 19:41 hrs. PDT.
The final step is to calculate the speed of the maximum Flood for our position on July 17th, 2015. We can assume that there is little or no water movement at the time of the Turn Before Flood and so no calculation is needed there.
When we look at the daily predictions for current at our reference station Juan De Fuca-East, July 17th, 2015, we can see that the Flood reaches a maximum speed of 1.4 knots (+1.4) at 18:56hrs.
On the far right of Table 4 under the heading, %Ref. Rate, we see that both the maximum Flood and Ebb speeds for River Jordan are predicted to be 70% of the daily predicted speeds for Juan De Fuca-East.
Accordingly, 70% of the daily predicted speed of the Flood at Juan De Fuca-East on July 17th, 2015 at 18:56 PST is .98kts.
Putting all of our information together, we now know that at our location near secondary station River Jordan, we can expect the Turn Before Flood to occur at approximately 16:48 hrs. PDT and the maximum flood to occur at approximately 19:41 hrs. PDT with a maximum speed of .98kts. ( 1.4 X 70% = .98 kts.)